Research / SPSS Model Breakdown
Economic development and life expectancy.
A multiple regression study of 179 countries using IBM SPSS Statistics 29. The project asks whether higher GDP per capita is associated with longer life expectancy, and whether that relationship still holds after controlling for health spending, demographics, and nutrition.
- Countries
- 179 150 complete cases
- Method
- Multiple regression IBM SPSS Statistics 29
- Model fit
- R² = .830 F(4,145) = 177.4, p < .001
01 / Research Question
Does higher income go together with longer lives?
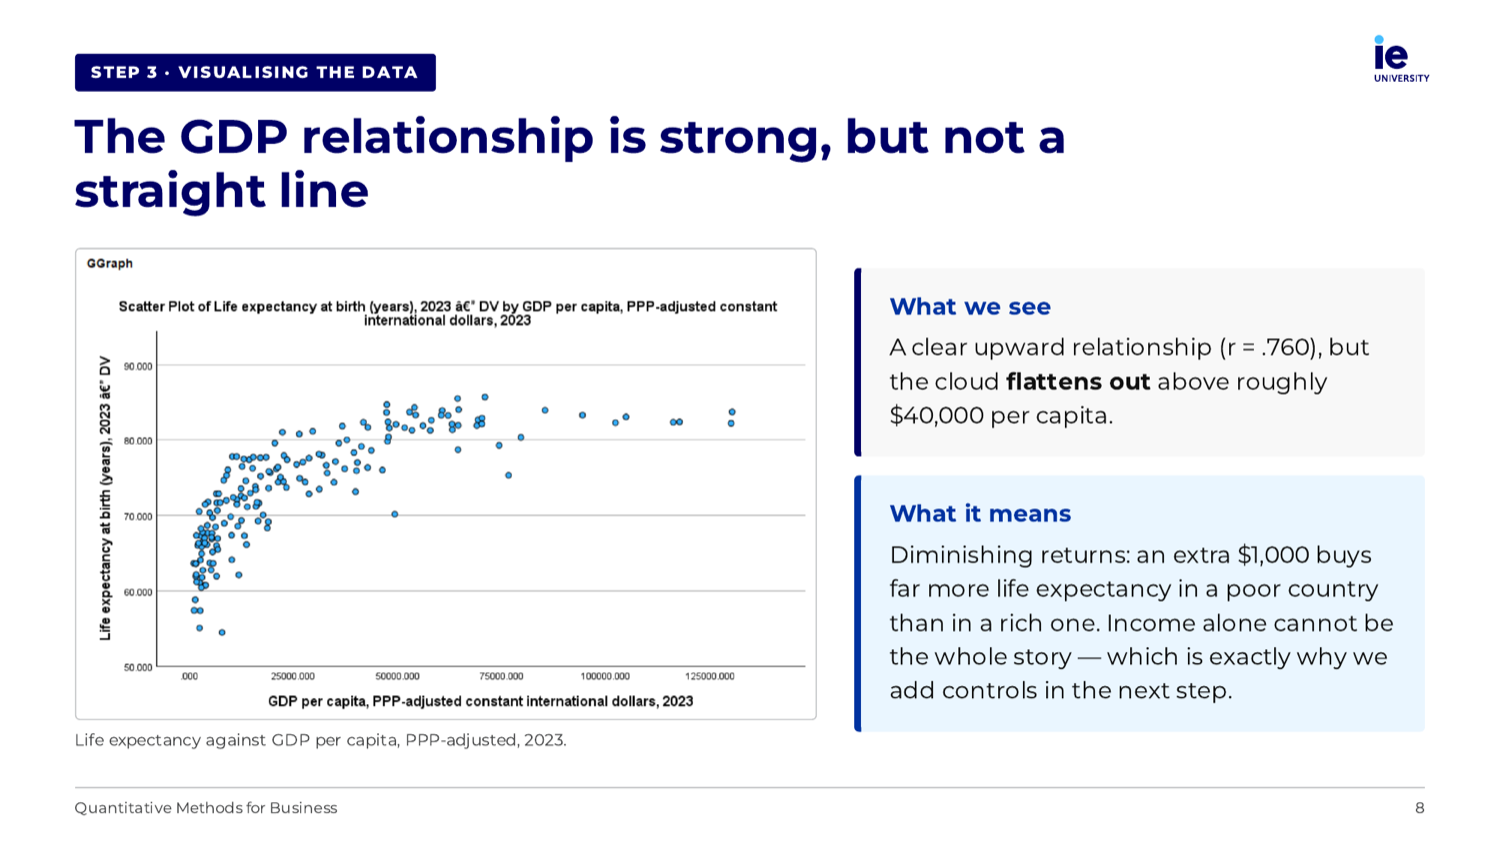
The dependent variable was life expectancy at birth in 2023. The main independent variable was PPP-adjusted GDP per capita in 2023. The hypothesis was that countries with higher GDP per capita would have higher life expectancy.
02 / Data and Variable Selection
From 17 candidate variables to a four-variable model.
The dataset started with 179 countries and 17 candidate independent variables. SPSS listwise deletion reduced the final model to 150 complete cases. Correlations showed several variables moved with life expectancy, but the model kept four channels: income, demographics, nutrition, and the health system.
Sanitation and urban population were removed because they overlapped strongly with variables already in the model. PM2.5 was removed after it became non-significant in regression.
- Income GDP per capita, PPP-adjusted
- Health system Government health spending
- Demographics Fertility rate
- Nutrition Undernourishment
03 / Model Building
Every block added explanatory power.
GDP alone explained 59% of the differences in life expectancy between countries. Adding government health spending, fertility, and undernourishment each improved the model significantly. Fertility added the largest extra piece after GDP.
04 / Final Regression and Coefficients
GDP stayed positive and significant after controls.
The final regression produced R² = .830, F(4,145) = 177.4, p < .001. The null hypothesis was rejected: together, GDP per capita, government health spending, fertility, and undernourishment explained a large share of cross-country differences in life expectancy. In plain language:
| Predictor | Change in predictor | Associated change in life expectancy |
|---|---|---|
| GDP per capita | + $10,000 | about 0.9 years gained |
| Fertility rate | + 1 birth per woman | about 2.8 years lost |
| Government health spending | + 1 percentage point | about 0.3 years gained |
| Undernourishment | + 10 percentage points | about 1.0 year lost |
05 / Diagnostics
The model checks were acceptable.
VIF values were below 3, tolerance was acceptable, Durbin-Watson was close to 2, and residual diagnostics supported the assumptions. Nigeria was the largest outlier, but removing it barely changed R² or coefficient signs, so it remained in the model.
06 / Mediation and Moderation
Nutrition partly mediated GDP; health spending did not moderate it.
GDP's effect partly ran through undernourishment: the GDP coefficient fell when undernourishment entered the model, but remained significant. Health spending did not significantly change the GDP effect. The interaction term produced R² change = .000 and p = .583, so the moderation hypothesis was not supported.
GDP per capita reduces Undernourishment which raises Life expectancy
07 / Conclusion
Income matters, but it is not the whole story.
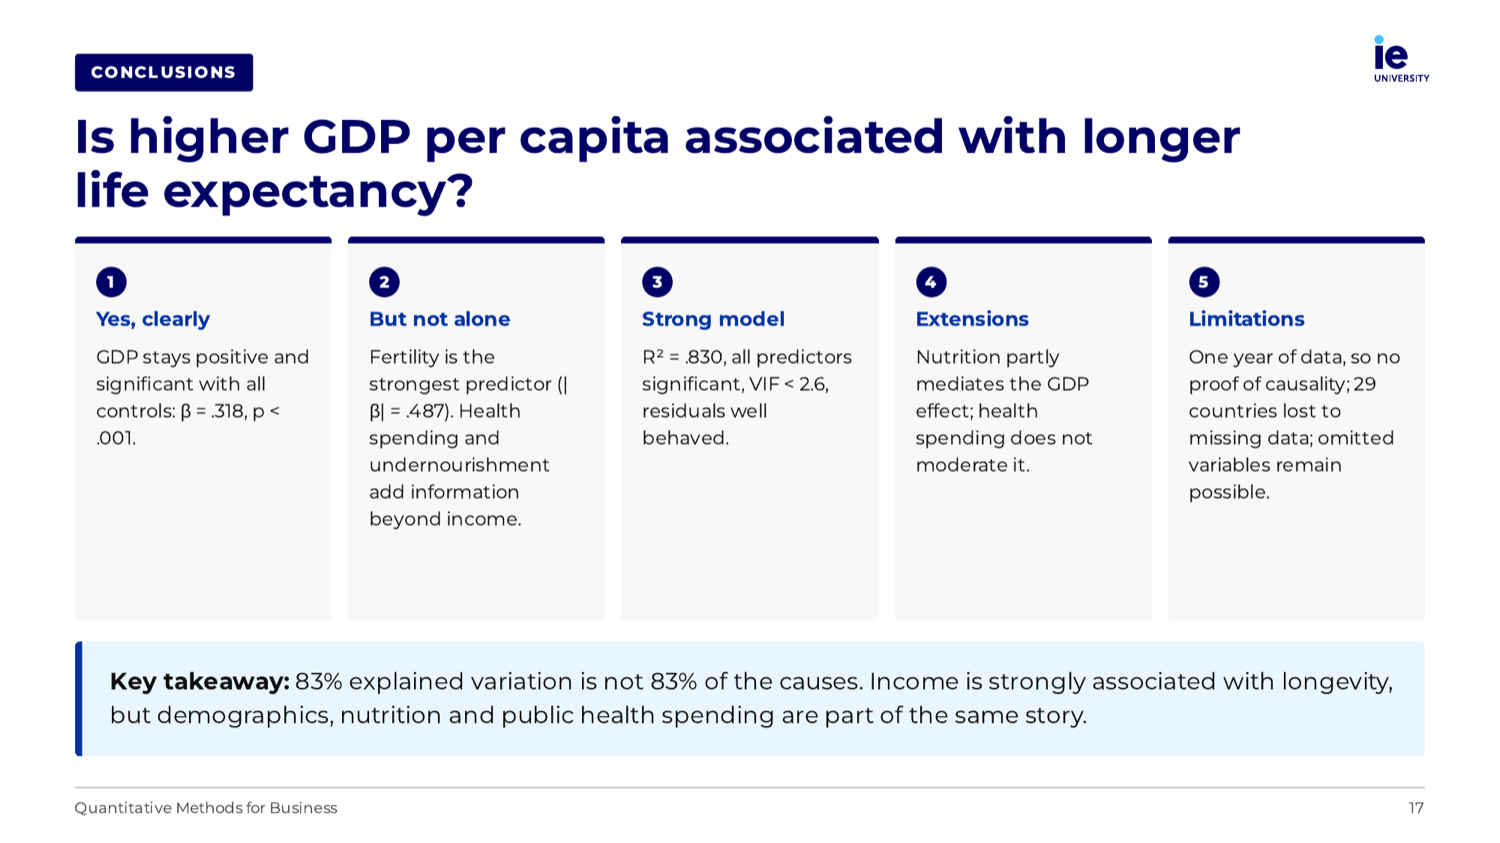
GDP per capita was clearly associated with longer life expectancy and remained significant after controls. But fertility, nutrition, and public health spending also added information.
83% explained variation is not 83% of the causes.
The model is strong, but the data are cross-sectional, so it cannot prove causality. One year of data supports association, not proof of cause and effect.
Full deck
The complete presentation.
Every table, chart, and diagnostic from the study, as presented.